Interactive Mapping
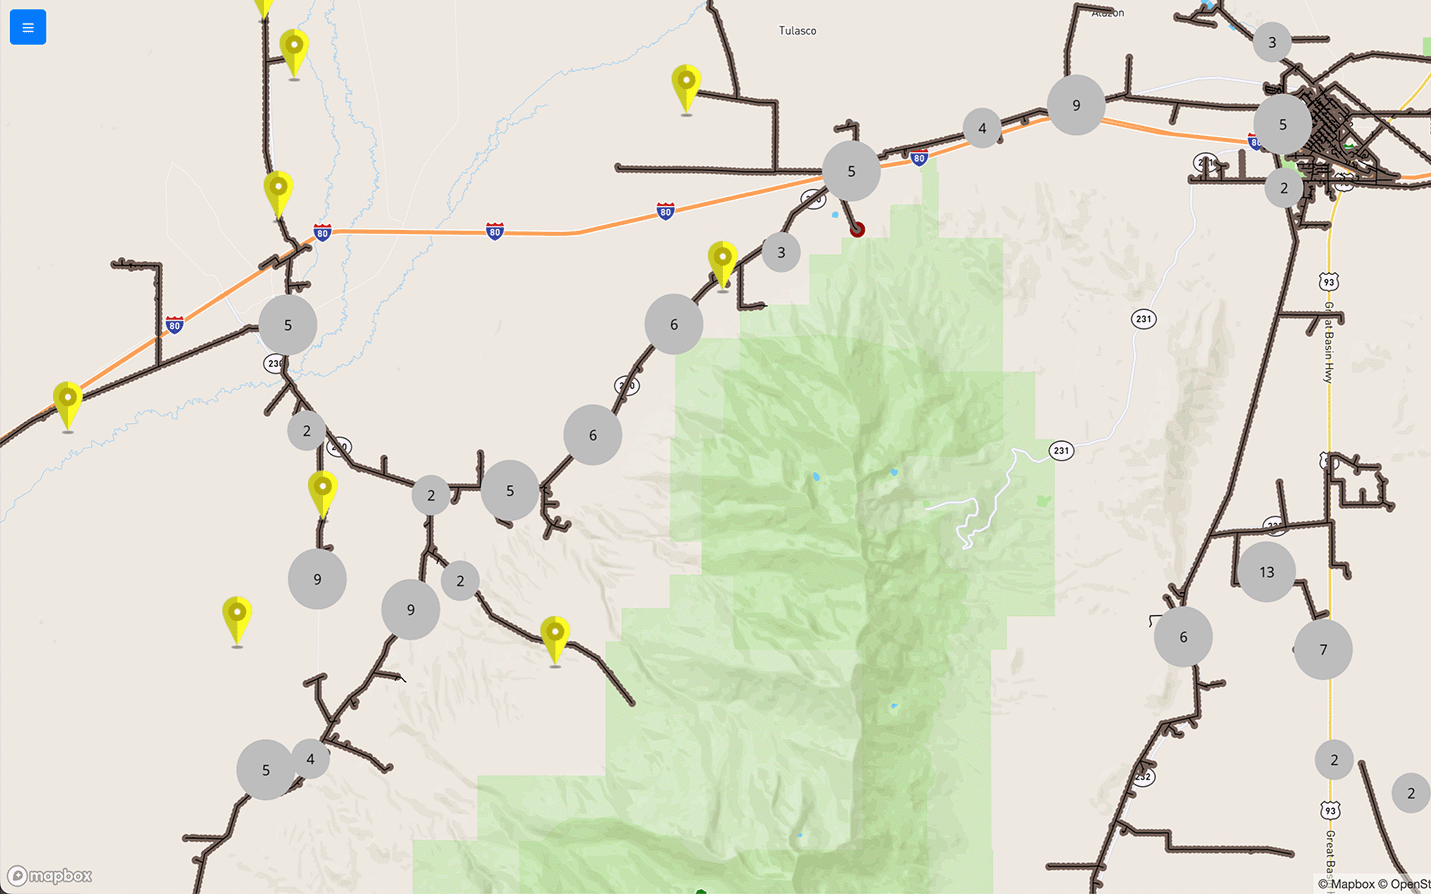
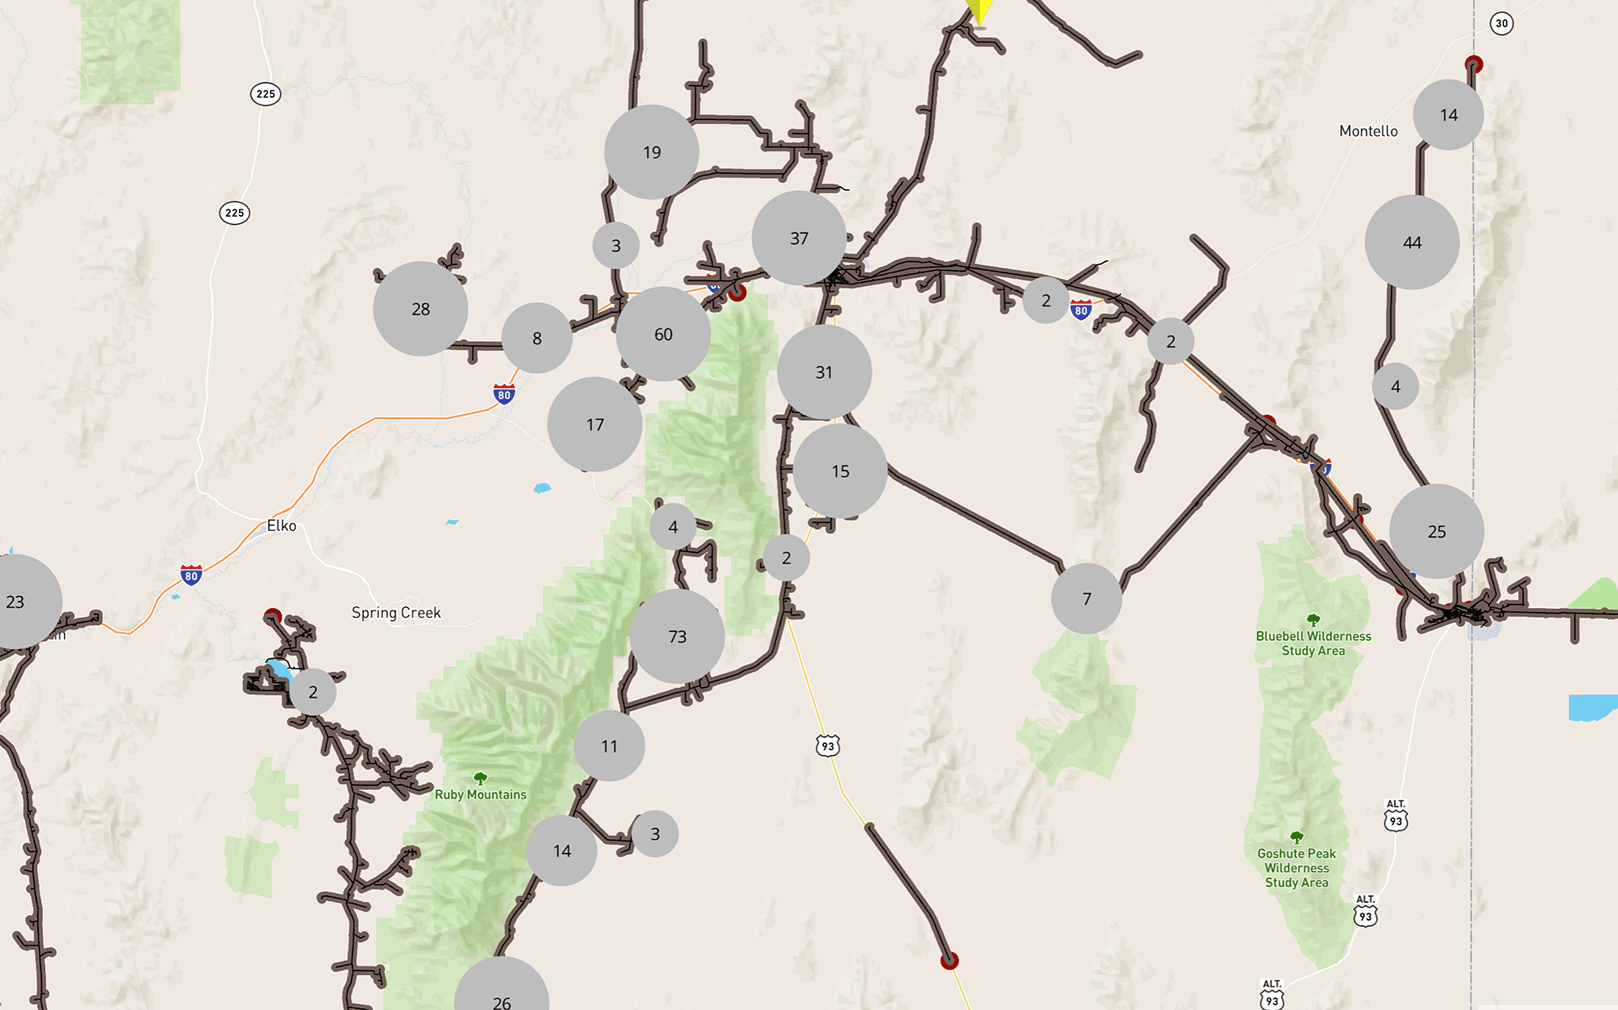
Simplify planning with PZM's mapping. Visual, color-coded deficiencies let you fix multiple issues in one trip, strengthening your system.

Visual, Color-Coded Deficiencies for Efficient Repairs & Stronger Systems


With PZM's risk matrix and Protection Zone Scoring, managing deficiencies becomes clearer and simpler for operations teams.
A Red icon indicates a major issue needing immediate attention.
Field teams appreciate PZM's easily recognizable icons, understanding the urgency at a glance.
With PZM's risk matrix and Protection Zone Scoring, managing deficiencies becomes clearer and simpler for operations teams.
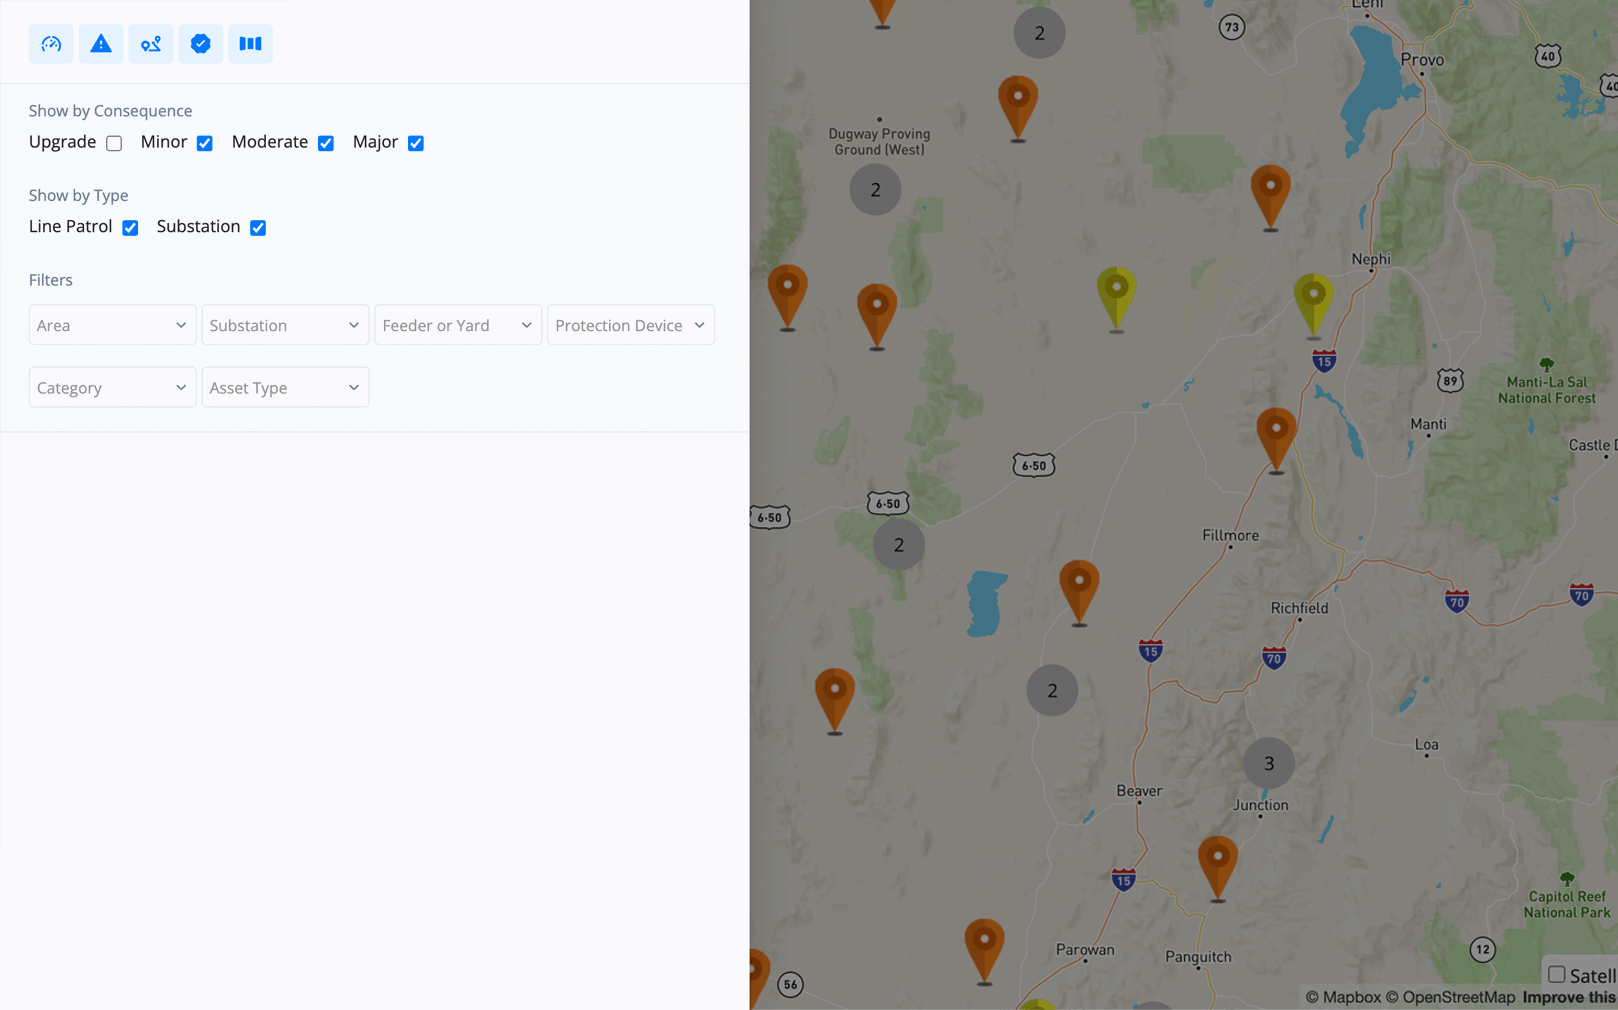
An Orange icon indicates a moderate issue needing attention.
Field teams appreciate PZM's easily recognizable icons, understanding the urgency at a glance.
With PZM's risk matrix and Protection Zone Scoring, managing deficiencies becomes clearer and simpler for operations teams.
A Yellow icon indicates a minor issue.
Field teams appreciate PZM's easily recognizable icons, understanding the urgency at a glance.
With PZM's risk matrix and Protection Zone Scoring, managing deficiencies becomes clearer and simpler for operations teams.
A Blue icon indicates an asset upgrade.
Field teams appreciate PZM's easily recognizable icons, understanding the urgency at a glance.
Meaningful Map Data That Helps You Get Work Done
PZM's mapping enables field crews and managers to effectively address substation and power line deficiencies.
Color-coded markers highlight major, moderate, minor, and upgrade issues, allowing teams to quickly identify and prioritize issues. This approach ensures faster, smarter operations, focusing on the most critical tasks first.
The PZM map is now our go-to tool. We can easily view all our poles, spans, and substations, along with any system deficiencies. It's the first place I check for planning and scheduling. Our team loves the clear, comprehensive overview it provides.
Tim Uhalde
Substation Engineering Manager at Mt Wheeler PowerPZM's Deficiency & Asset Mapping Solution
Management & Operations Teams Love PZM!
-
Clear Deficiency Identification
Color-coded icons highlight major, moderate, and minor issues at a glance.
-
Efficient Planning
Visualize poles, spans, and substations to streamline scheduling and resource allocation.
-
Risk & Consequence Prioritization
PZM's Risk Matix and PZ Score ensure critical issues are addressed first.
-
Enhanced Coordination
Easy-to-understand icons layered on pole, span, and substation infrastructure improve communication among team members.
-
Comprehensive Overview
View your entire infrastructure and deficiencies in one place, without the bloated meta data.
-
Time Savings
Quickly identify and prioritize tasks, reducing downtime.
-
Improved Decision Making
Data-driven insights lead to more informed personnel.
-
User-Friendly Interface
Intuitive design makes it easy for all team members to use.
-
Increased Efficiency
Focus on the most pressing issues first, improving overall system reliability.
-
Scalable Solution
Adaptable to various field service operations, from small teams to large organizations.
Getting Started with PZM is Risk-Free!
We handle all the setup so you can continue with your busy schedule. Contact us today to simplify your workday!